Hurricane Katrina: Ten Years Later

The most infamous storm in U.S. history, Hurricane Katrina carved a path of destruction from Miami to New Orleans, and up the Eastern United States. The storm reached a maximum intensity of Category 5 status, with 175 mph sustained winds. Hurricane Katrina made landfall in the morning of August 29, 2005. This infrared satellite imagery shows the storm’s intensity: white is the most intense, followed by red, green, and blue.
Audio Podcast
Ten years after Hurricane Katrina, we talk with two pollution responders from NOAA's Office of Response and Restoration who were working in Louisiana after the storm. View transcript, download episode, and get show notes here.
Coastal community resilience: progress made, lessons still to learn.
Conversations about coastal community resilience have changed tremendously in the past decade. Before Katrina, many people considered hurricanes, tsunamis, and other hazardous weather events as trials that happened to someone else.
But the trilogy of storms in 2005 — Katrina, Rita, Wilma — started a marked change in perception, as the possibility of real catastrophe and devastation was realized. Sandy, in 2013, drove home the point even further, highlighting the deadly combination of an increasing population coupled with the increasing strength and reach of tropical storms. And for those who escaped the eye of a storm, nuisance flooding, which is also on the rise, taxed the infrastructure and coffers of hundreds of communities — including such major coastal cities as Norfolk, Charleston, and Miami.
Coastal Community Preparedness Goals
NOAA is working to ensure our nation’s preparedness. Learning from the past decade, we are working with coastal communities to make the following part of the goals set for the next 10 years:
- Identify Risk. Even the most educated among us fail to appreciate risk exposure. Risk varies by location and is influenced by development, geographical features, ocean bathymetry, economics, even the will of the people and local officials. It is nearly impossible to decrease vulnerability without understanding risk.
- Understand What Can Be Done. In addition to changing building codes and preparing for redevelopment opportunities, cities are looking for other means of preparation. Green infrastructure, the use of natural areas that mimic natural hydraulic processes to reduce flooding impacts, represents an approach many communities are embracing. Each community’s situation, and therefore approach, will be different.
- Participate in Blue Sky Planning. The time to prepare is before disaster strikes. Scientists, planners, engineers, politicians, local officials, citizens, and the private, government, and non-proft sectors must work together to understand, develop strategies, and implement.
- Don’t Forget the "People Side" of Coastal Management. Social science research tells us that pre-existing social conditions help determine how quickly recovery occurs. Wealth, poverty levels, job security, percentage of home ownership, race, gender, and ethnicity are all indicators to consider. Community leaders should incorporate social science data and approaches into their resiliency efforts.
NOAA and Coastal Resilience: Data, Tools, and Technical Assistance
NOAA plays an integral role in advancing community planning efforts by providing data, tools, and technical assistance. Here are a few examples.
Data and Tools
Having data is important, but the way data is presented often determines whether or not data is actually useful. NOAA provides data and the related tools and information that make it easier for people to “see” what these data are representing.
- Sea Level Rise Viewer: Use the toggle to simulate various levels of sea level rise and see how the community is impacted in terms of flooding reach. View this tool.
- Coastal Flood Exposure Mapper: Pick a location to see maps that show the people, places, and natural resources exposed to coastal food hazards. View this tool.
- Coastal County Snapshots: Flood exposure, wetlands, jobs – communities use the snapshots to get county level data that is automatically served up in a printable format, complete with charts and graphs. View this tool.
These are just a few of the hundreds of resources available from NOAA’s Digital Coast.
Technical Assistance
Having data is important, but the way data is presented often determines whether or not data is actually useful. NOAA provides data and the related tools and information that make it easier for people to “see” what these data are representing.
- Grants: NOAA is providing more than $9 million in coastal resilience grants to enhance coastal communities and restore coastal habitat. The President’s budget proposes to expand that effort to $50 million in fiscal year 2016. Local and state matching investments magnify the impact of these grants.
- Green Infrastructure: Parks, beaches, wetlands—many natural areas absorb excess water and provide natural habitat, clean water, and recreational opportunities. NOAA provides a training class and numerous information resources to help communities incorporate green infrastructure in their planning efforts. Examples of this approach can be found at sagecoast.org, a public-private effort sponsored by NOAA, FEMA, USCG, VIMS along with other federal, state, and local agencies, non-governmental organizations, academic institutions, engineers, and private businesses working together to promote effective green infrastructure use and best practices.
- FEMA Rating System: FEMA encourages communities to earn points for actions taken to increase community resiliency, which FEMA awards by providing lower food insurance rates for all citizens. NOAA’s Digital Coast, a data and tool delivery system for coastal communities, provides the local data and information communities need to undertake many of the tasks associated with this rating system.
- National Weather Service Assistance: NOAA’s Office for Coastal Management is working with the National Weather Service to use social science findings to increase the public’s understanding of hazardous weather messages. A "fast-draw" video used to inform citizens about storm surge reach has been particularly popular.
- Coastal Community Resilience Index: NOAA provides a simple, inexpensive method for performing a self-assessment of community resilience called the Coastal Community Resilience Index. So far 54 communities have used this process to identify strengths and weaknesses and prioritize actions to be taken prior to the next hazard event.
- Climate Outreach Community of Practice: NOAA is supporting a volunteer network of officials from Gulf States who are working together to explore Gulf coast climate science, adaptation, and lessons learned. This group is also developing shared messages and goals for the future. These relationships help communities get the information and momentum needed to take action.


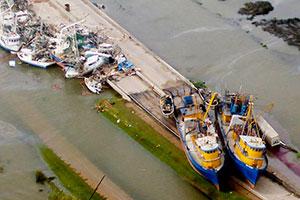
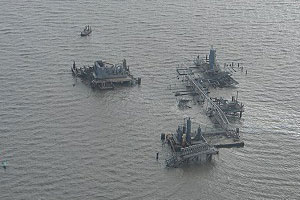
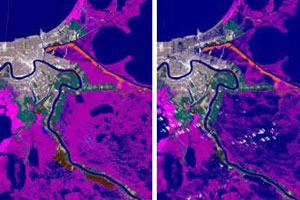
Hurricanes Katrina, Rita, and Wilma reminded us of nature's power. Communities were destroyed and lives lost and devastated by these back-to-back storms. The loss of life and extraordinary damage made Katrina the costliest hurricane in U.S. history and the deadliest hurricane in 77 years. Here, a before and after image of the city of New Orleans, Louisiana, near the Superdome shows one example of the incredible devastation and flooding wrought by Katrina.
Ten Years of Progress
Ten years later, we remember the lives lost as well as the impacts the storms had on communities in the Gulf. This solemn occasion reminds us that we must stay vigilant and committed to our overall mission. We have made progress over the past ten years, but we know there’s more work to be done to ensure communities have access to timely, accurate, and reliable weather forecasts. Here are few examples of progress made by the National Ocean Service since 2005:
- Improving Aerial Imagery and Post-Survey Analysis Capabilities. Over the past ten years, NOAA’s National Geodetic Survey has made upgrades to camera equipment and post survey analysis to provide better maps and images of coastal communities. Coastal managers use these data to update resilience plans and to help determine which areas are at risk to threats and vulnerabilities associated with severe storms.
- Monitoring Sea Level Change. Since Katrina, NOAA's Center for Operational Oceanographic Products and Services has installed "storm ready" water level stations in the Gulf, including a new station to monitor storm surge on Lake Pontchartrain in partnership with the National Weather Service and five hurricane-hardened water level stations, implementing a Mobile Bay Storm Surge Network. These storm surge monitoring assets are used in the Storm QuickLook product, which has been updated since Katrina and provides a more user-friendly interface showing near real-time observations at locations affected by tropical cyclones. Several sea level gauges in the Gulf have operated for more than 30 years, now providing consistent high-quality records of sea level change. Communities can use this data to become more resilient as they prepare for climate-driven nuisance flooding and extreme coastal storms. In addition, CO-OPS brought online seven new Physical Oceanographic Real-time Systems (PORTS®) offering real-time oceanographic and meteorological information to the Gulf's maritime community.
- Serving Coastal Communities. NOAA’s Office for Coastal Management has developed the Digital Coast website, which is focused on helping communities address coastal issues and has become one of the most-used resources in the coastal management community. The dynamic Digital Coast Partnership, whose members represent the website’s primary user groups, keeps the effort focused on customer needs.
- Delivering Tools to Understand Coastal Risk. Through the Digital Coast website and other Office for Coastal Management tool-oriented sites, NOAA is providing both coastal managers and residents the opportunity to better understand their risks under a variety of potential situations. For instance, people can better understand storm surge by using the coastal storm surge inundation maps and coastal flooding visualization tools, and they can better understand climate change-driven impacts such as sea level rise by using the Sea Level Riser Viewer.
- Improving Response to Coastal Spills. NOAA’s Office of Response and Restoration has continued to upgrade its response capabilities for dealing with coastal oil and chemical spills, which are not uncommon after hurricanes. These efforts include updating environmental sensitivity maps for the Gulf states; upgrading assets and information about chemicals of concern in inundation-prone locations; improving its oil spill trajectory forecasting tools; and expanding the ERMA online response mapping software that was first used in the Deepwater Horizon oil spill in 2010. OR&R has also expanded its training on the science of oil spill response, shoreline cleanup and assessment, and aerial observation of oil spills.
- Developing an Advanced Storm Surge Model. NOAA’s Office of Coast Survey is developing an advanced storm surge model to drive total water predictions. Based on the coastal ocean model, this system provides advanced computations that couple storm surges and tides and dynamically models the ocean’s response as a hurricane tracks across the ocean and crosses inland. An envelope of potential inundation predictions is generated based upon the National Hurricane Center’s forecast.
- Reducing Impacts of Severe Storms. While we cannot prevent hurricanes and other severe events, we can reduce their impacts by helping to prepare federal, state, and local decision makers for a variety of hazards and threats. NOAA's Gulf of Mexico Disaster Response Center state-of-the-art facility offers a regional coordination center to enhance all hazards preparedness, response, and recovery; training courses and technology demonstrations; meeting space for emergency preparedness trainings and drills; and a disaster-ready facility available as an emergency operations center during crisis situations.
- Advancing Ocean Observing System Capabilities. Post-Hurricane Katrina, the Gulf Coast Ocean Observing System, part of the U.S. Integrated Ocean Observing System®, has achieved major advances in its scientific capabilities associated with climate-related extreme event observations of oceanographic conditions including sea surface height, sea surface temperature, salinity, currents, and wind speed. These near real-time observations have dramatically enhanced weather forecasting, visualizations, and decision-support tools to inform community preparedness in extreme weather events. The Gulf Coast Ocean Observing System is one of eleven U.S. Integrated Ocean Observations Regional Associations. NOAA provides funding for the Regional Associations and leads the U.S. IOOS Program.
- Responding to Disaster Debris.The NOAA Marine Debris Program is taking a proactive approach to planning for disasters. Dealing with disaster-related debris events following natural disasters can be a challenge. In response, the program is working across coastal regions to develop state plans intended to improve preparedness and facilitate a coordinated, well-managed, and immediate response to this type of marine debris. Earlier this year, the program released the Alabama Incident Waterway Debris Response Plan and Field Guide, the first in a planned series.
Quick Links
More Stories
Sea Level Trends
Pollution Response
Coast Survey Response
Water Level Stations
Get Social
More Information
Did you know?
.")
America’s coasts have extreme disaster potential. The shore-adjacent counties of the U.S. are six times more densely populated than the remainder of the U.S., a population that has been growing faster than the nation as a whole for several decades.
Even with our improved warning systems, thousands of Americans lives were lost in extreme weather events over the last ten years. During the past ten years more than 80 of these extreme events occurred in the United States, resulting in damages to infrastructure, crops, homes, and businesses exceeding $1 billion each, and total losses exceeding $500 billion.
Photo Credit: Amy McGovern (with permission)
